

Distributed Tracing for Spring Boot Apps using Micrometer and OpenZipkin


With the emergence of Cloud technologies and microservices, the Observability of your application demands attention like never before. Before we go any further, let us take a step back and define Observability.
"Observability can be defined as how well you can understand the internals of your system by examining its outputs."
Suppose your application has 50 microservices distributed across the cluster. Users send requests where each request could span multiple microservices before returning the response. If there is a performance bottleneck at some point during the request processing, how can we analyze that? How can we know the execution times of each microservice to analyze latency problems? What if we want some metadata associated with each microservice call that helps us to debug the issue much faster? This is where traces and spans come to your rescue. Going back to the definition above, Observability is achieved with the help of some outputs generated from your application. Traces are one such output, with the other two being metrics and logs. In this article, we are discussing how we can achieve distributed tracing in a Spring boot application using the built-in Micrometer library.
What is Micrometer?
Micrometer provides a simple facade over the instrumentation clients for the most popular observability systems, allowing you to instrument your JVM-based application code without vendor lock-in. Micrometer provides an Observation API that can be used to instrument our code and get multiple benefits out of it, one such benefit being generating traces and spans. Micrometer offers a module called Micrometer tracing, which can be used to generate traces and spans. Micrometer tracing when coupled with Observation provides a very powerful capability of instrumenting a piece of code by creating an Observation around the code and generating spans from the instrumented code. Micrometer tracing acts as a convenient wrapper around some popular tracer libraries such as OpenZipkin and OpenTelemetry.
Let's see distributed tracing in action...
In our sample application, we have an Inventory service that accepts an item and checks if the item is present in the inventory. If the item is not present, the service throws an exception. We also have an Inventory Client that sends multiple requests to the inventory service, for a set of items.
Let's take a peek into the Inventory Service first.
Please find the dependencies used for implementing Observability coupled with tracing.
<!-- Simplified for brevity -->
<dependencies>
    <dependency>
        <groupId>org.springframework.boot</groupId>
        <artifactId>spring-boot-starter-actuator</artifactId>
    </dependency>
     <dependency>
        <groupId>io.micrometer</groupId>
        <artifactId>micrometer-tracing-bridge-brave</artifactId>
    </dependency>
    <dependency>
        <groupId>io.zipkin.reporter2</groupId>
        <artifactId>zipkin-reporter-brave</artifactId>
    </dependency>
</dependencies>
We add spring-boot-starter-actuator for anything and everything related to the Observability in spring-based applications, and the cool part is spring-boot-starter-actuator uses the Micrometer library under the hood, therefore transitively pulling in those dependencies. However, we must add the Micrometer tracing library separately. micrometer-tracing-bridge-brave provides a wrapper around Zipkin brave tracer. If you want to use Opentelemetry instead, Micrometer tracing provides a dependency for that too. It does not force you to choose a particular vendor. Finally, zipkin-reporter-brave is used to export the generated spans to the OpenZipkin server running locally (running on port 9411).
Let's take a look into application.properties
# simplified for brevity
management.tracing.sampling.probability=1.0
logging.pattern.level=%5p [${spring.application.name:},%X{traceId:-},%X{spanId:-}]
By default, Micrometer sends just 10% of total spans to the OpenZipkin server, to not overwhelm the server. We can override that by setting the value to 1.0, ensuring all the spans are sent to the remote server. Micrometer tracing also provides Log Correlation out of the box. This means that log statements can print traceID and spanID, provided we modify the pattern as above. This can be extremely useful while performing log analytics.
Let's take a look at the Inventory Service where we want to observe the code and gather insights out of it, in the form of metrics, logs and spans.
private final ObservationRegistry observationRegistry;

public InventoryService(ObservationRegistry observationRegistry) {
    this.observationRegistry = observationRegistry;
}

public String returnInventoryItem(String item, String userId) {
    return Observation
            .createNotStarted("check.item.availability", observationRegistry)
            .contextualName("check-item-availability")
            .highCardinalityKeyValue(KeyValue.of("userId", userId))
            .lowCardinalityKeyValue(KeyValue.of("itemName", item))
            .observe(() -> {
                LOGGER.info("Retrieving item: {} for user: {}", item, userId);
                return returnInventoryItemOrThrow(item);
            });
}
Observation is registered in the ObservationRegistry. Spring Actuator provides ObservationRegistry as a managed spring bean. The above code wraps an Observation around a method called returnInventoryItemOrThrow(item), which is the method we want to observe. By doing so, we create a metric by the name check.item.availability and a span by the name check-item-availability. We are also tagging userId and itemName in the generated span. Tags can act as useful metadata when debugging issues in production. userId is a high cardinality data, which means it can take an unbounded possible set of values. On the other hand, itemName can take only a limited set of values, hence it can be categorized as low cardinality data. When the above statement gets logged, Micrometer would inject the traceID and spanID into the log statement automatically.
That's all on the backend side. Let's take a peek at the client service. The client uses RestTemplate to call the Inventory Service. RestTemplate is instrumented so that whenever we make a REST call, the Micrometer tracer will generate a new span and make the new span child to the current span. This would eventually form a tree-like structure of spans, and all these related spans would come under a trace.
@Bean
RestTemplate restTemplate(RestTemplateBuilder builder, ResponseErrorHandler errorHandler) {
    return builder.errorHandler(errorHandler).build();
}
Please make sure to build RestTemplate from RestTemplateBuilder, so that RestTemplate is instrumented. Another point to note is that the traces and spans generated by the client will get propagated to the server automatically. Context propagation is handled by Micrometer out of the box. This would make sure that we have an end-to-end trace for each request originating from the client side.
After running the application, please take a look at the trace diagram recorded by the OpenZipkin server below.
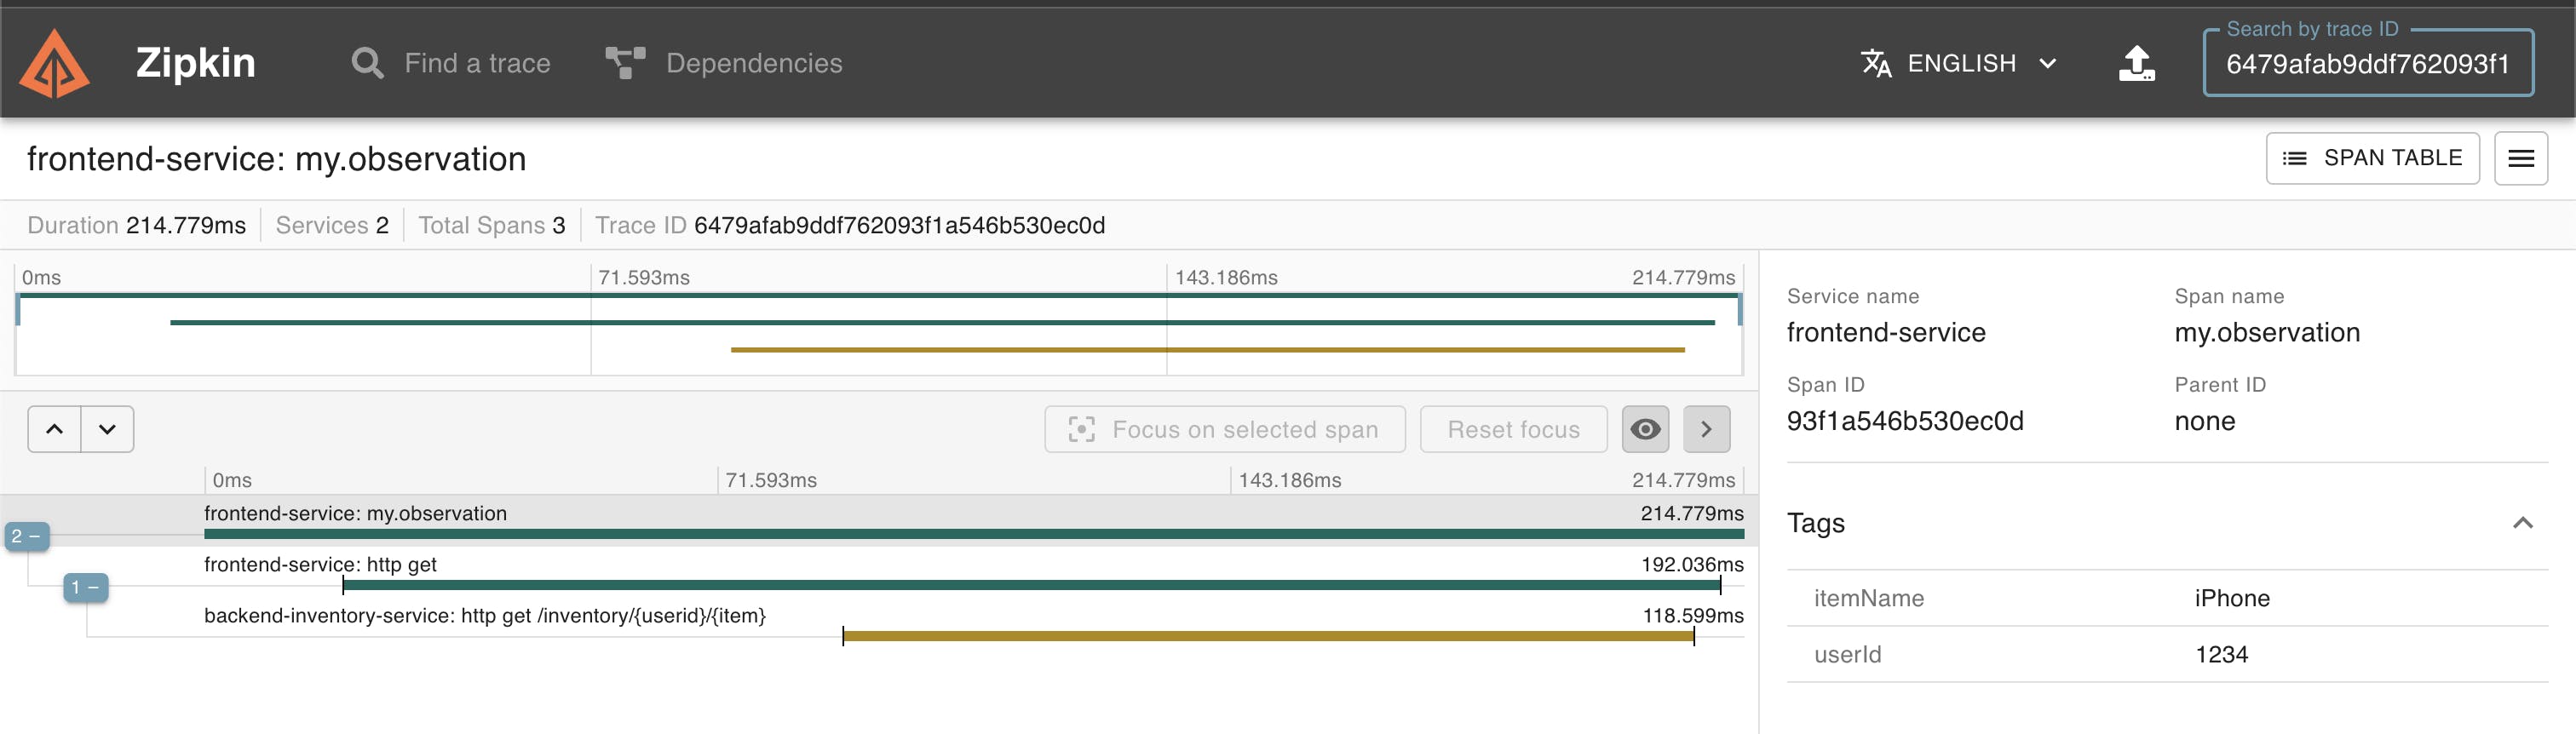
The above diagram shows a trace of one of the several requests made from the client side. This particular trace contains three spans. Out of three, two spans come from the client service and the last span comes from the backend Inventory Service. The dashboard also shows how long each span takes to complete. This is useful while analyzing latency issues. When you click on each span, you may see the Tags associated with those spans, which can provide useful metadata while analyzing production bugs.
Wrapping Up
Even from such a trivial application, you can see the benefits of distributed tracing. In this modern age, the significance of distributed tracing in a highly-scalable cloud-based microservices cannot be overstated. I hope you can see it now!
You may find the link to the full source code here.